Learn how ultra‑high‑frequency ECG reveals ventricular activation patterns, electrical dyssynchrony, and pacing outcomes beyond conventional ECG.


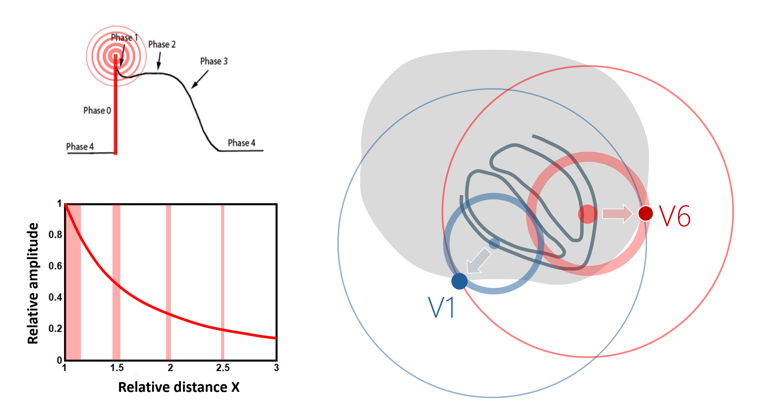
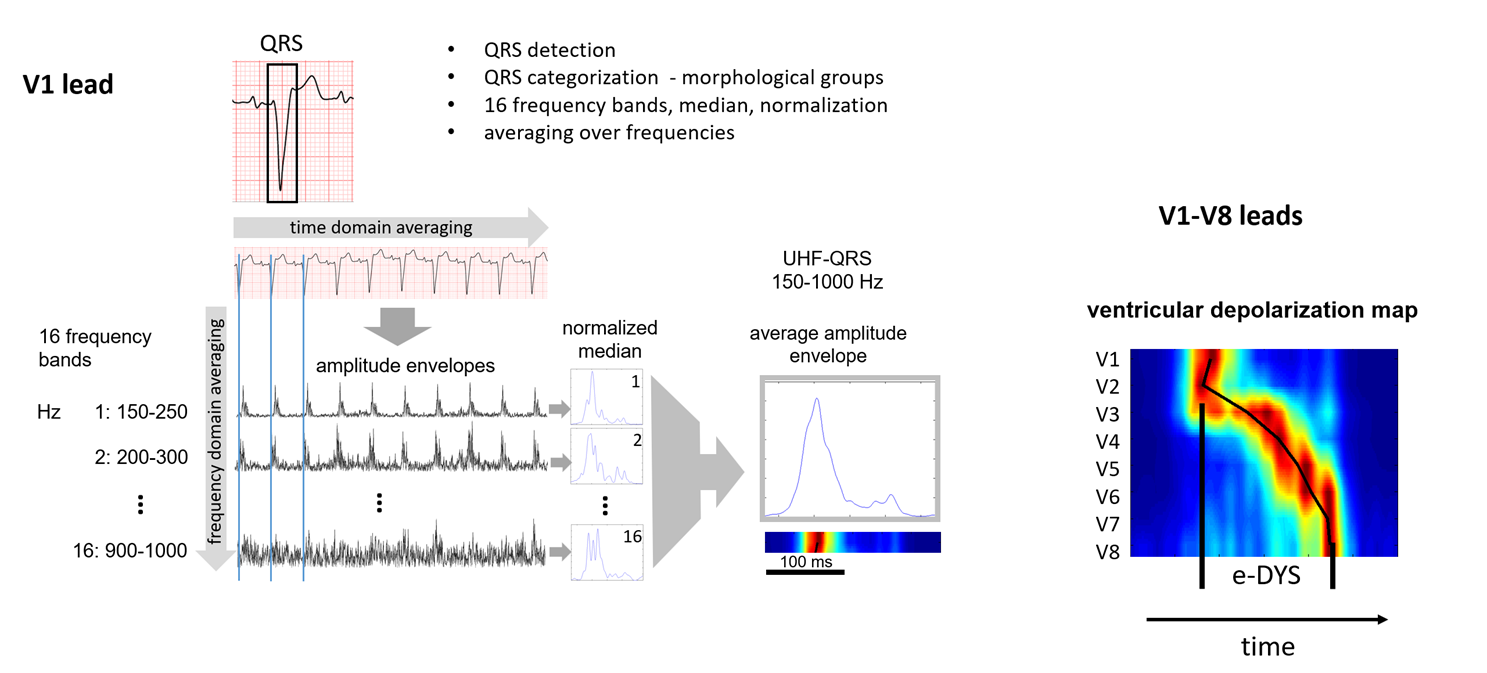
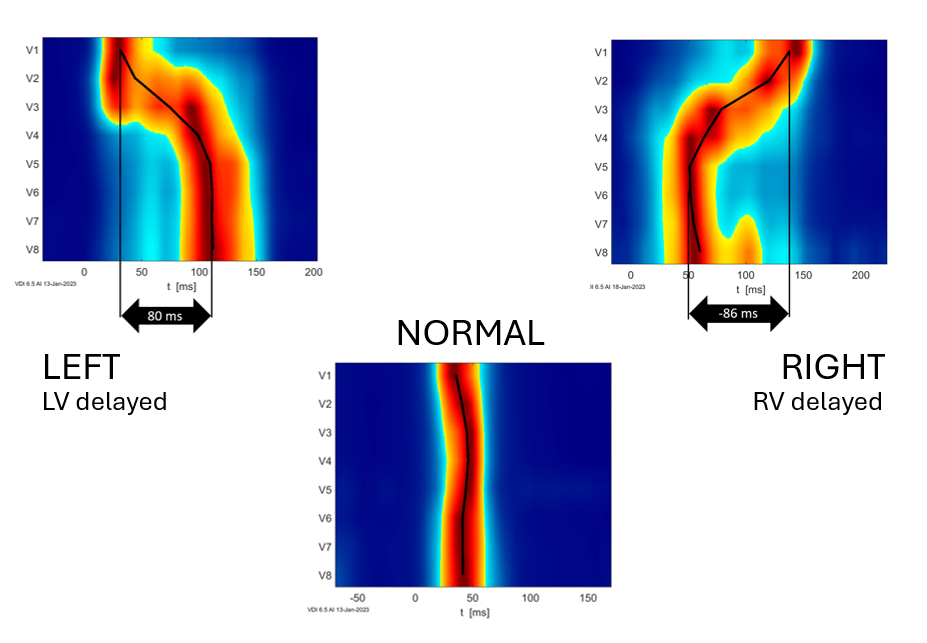
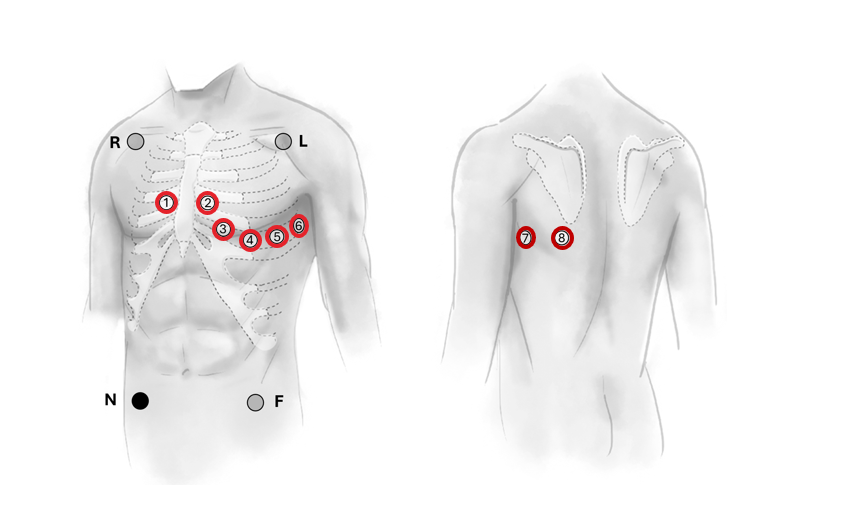
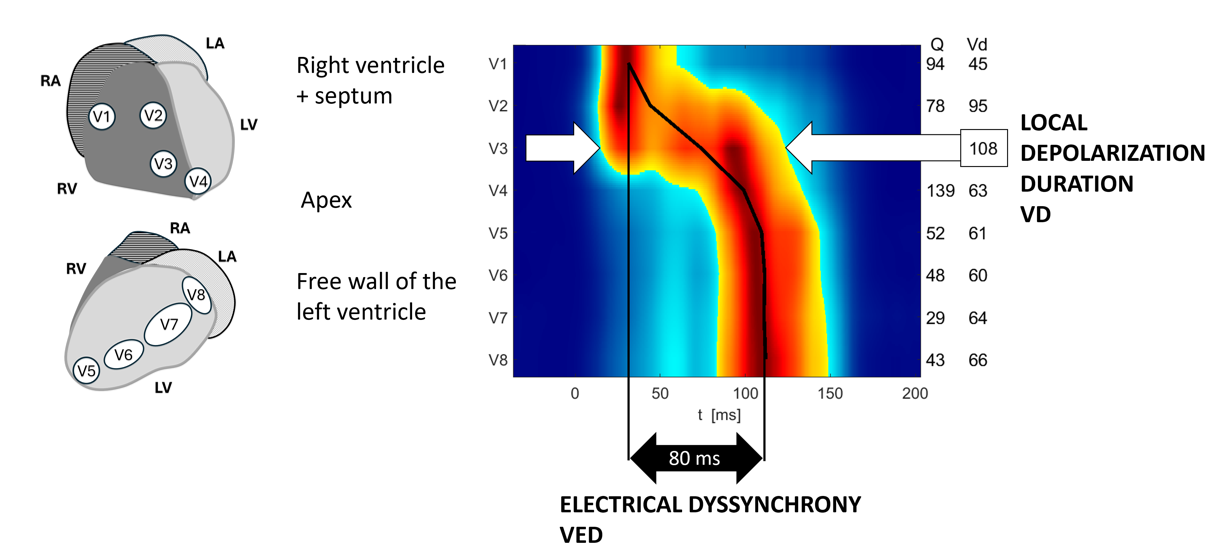
UHF‑ECG captures frequency components up to 1000 Hz during ventricular depolarization, enabling visualization of activation timing beneath individual chest leads. In 12(14)-Lead ECG Mapping, standard chest electrodes are used without invasive instrumentation, and recorded signals are transformed into activation maps that show when ventricular regions depolarize beneath each lead.

We are providing new information that cannot be fully replaced by any other parameter obtained from a standard ECG. During depolarization, an action potential produces the UHF components up to 1000 Hz detected by highly sensitive VDI UHF‑ECG technology. UHF oscillations attenuate quickly with distance from their source, so the VDI technology can precisely localize depolarized regions.
UHF oscillations are extremely weak, requiring patented advanced real‑time signal processing. The method detects and categorizes QRS complexes, analyzes multiple frequency bands, normalizes and averages amplitude envelopes, and converts the processed UHF‑QRS signal into a ventricular depolarization map.

Activation maps clearly show ventricular activation patterns and help distinguish delayed left ventricular activation, synchronous activation, and delayed right ventricular activation.

Typical left bundle branch block pattern with delayed LV activation.
Physiological ventricular activation with minimal delay between chest leads.
Typical right ventricular delay pattern, visible as a shifted activation sequence.
All ventricular segments under the chest leads are activated almost at the same time.
Dyssynchronous activation shows a significant time delay between individual chest leads.

A curated collection of real‑world activation maps demonstrating spontaneous conduction, bundle branch block patterns, conduction system pacing, CRT optimization, and ventricular pacing strategies.